Market Analysis
Invest in Central Asia
Central Asian Region with Promised Business Opportunities
Central Asia, broadly defined as the region east of the Caspian Sea incorporating Kazakhstan, Uzbekistan, Turkmenistan, Tajikistan, and Kyrgyzstan, has emerged as one world’s fastest-growing regions since the late 1990s and has shown notable development potential. Among the region's advantages are its high-priced commodities (oil, gas, cotton, and gold), reasonable infrastructure and human capital, and a strategic location between Asia and Europe. Furthermore, Central Asian regions have already transitioned into market-oriented economic reforms to boost economic performance and private sector competitiveness. These key characteristics of countries have long been in the central interests of numerous developed countries to deepen economic relations and develop investment potential to expand trade turnover.
The total area of the countries of the Central Asian regions is more than 4 million square kilometers. The northern part is covered with Kazakhstan, which covers almost 68 percent of the entire territory. Kazakhstan bordered Russia from the north, and half of the western part stretches the Caspian Sea, from where it has direct sea access to Azerbaijan and Iran.
The eastern part of Central Asia, consisting of Kazakhstan, Kyrgyzstan, and Tajikistan, borders China. The total area of Kyrgyzstan is about 200 thousand square kilometers, whereas Tajikistan is 142 thousand square kilometers. The southern part of Central Asian countries borders most Turkmenistan between Iran, Uzbekistan, and Tajikistan to Afghanistan. The total area of Uzbekistan is about 450 thousand square kilometers, and Turkmenistan is more than 50 thousand square kilometers larger than Uzbekistan.
These regions have no international access to the sea. One of the negative reasons for sustainable economic growth is landlocked economies with no access to the sea for trade. Thanks to the recent joint efforts of the governments of these countries, infrastructure is being developed and expanded to build alternative routes of international logistics corridors with access to the sea for closer countries bordering Central Asia, such as Russia, China, Afghanistan, and Pakistan. These measures and other air and transport roads, including railways, are gradually filling transport gaps and partially overcomes the transportation problems of landlocked economies.
Traditions, culture, and language in Central Asia are very similar and, in many ways, related. Strong respect for elders is also common in Central Asia. People also attach great importance to family and homeland.
Most of the population speaks their native language: Kazakh, Uzbek, Kyrgyz, Tajik and Turkmen languages. The peculiarity is that these languages are considered as the ancient Turkish and partly Persian dialects. The influence of the previous Soviet Union is an important factor in the culture of Central Asia. Russian is spoken in all countries of Central Asia. After the collapse of the Soviet Union, these countries focused on independent development policies, developed international and diplomatic relations with almost all countries. Consequently, young people focused on the study of foreign languages. Therefore, among the younger citizens, knowledge of the English language has become much more popular.
Economic Trends Performance
A unique blend of economic, political, and geographical features, which influences its economic development experience, has increasingly focused policy, business, and investors' interest in the Central Asian region. From 2001 to 2015, annual GDP grew by 7.0% per year in Central Asia compared with negative growth (- 3.4) in the previous decade (see Table 1.). In 2016, growth declined to 4.9%, while stable growth remained for 2017 and 2019 at an average of 5.5%. Despite the low base the growth rates of these Central Asian countries, the region is the highest post-transition for any CIS countries group and differs from the fastest growing economies in Asia and the rest of the developing world.
Table 1. GDP growth (%)
|
|
1992-2000 Average |
2001-2010 Average |
2011-2015 Average |
2016 |
2017 |
2018 |
2019 |
2020a |
2021a |
|
Oil Exporters |
|||||||||
|
Kazakhstan |
-3.4 |
8.3 |
5.6 |
1.1 |
4.1 |
4.1 |
4.5 |
-2.5 |
3.2 |
|
Turkmenistan |
-1.8 |
7.8 |
10.6 |
6.2 |
6.5 |
6.2 |
6.3 |
0.8 |
4.6 |
|
Non-oil Exporters |
|||||||||
|
Kyrgyz Republic |
-3.5 |
4.2 |
4.9 |
4.3 |
4.7 |
3.8 |
4.5 |
-8.0 |
6.0 |
|
Tajikistan |
-8.4 |
8.1 |
7.0 |
6.9 |
7.6 |
7.3 |
7.5 |
4.5 |
5.0 |
|
Uzbekistan |
-0.1 |
6.8 |
7.5 |
6.1 |
4.5 |
5.4 |
5.6 |
1.6 |
5.0 |
|
Central Asian Republics b |
-3.4 |
7.0 |
7.1 |
4.9 |
5.5 |
5.4 |
5.6 |
-0.7 |
4.8 |
Source: 1992-2019 from World Bank Data and 2020-2021 from IMF.
a forecasted value given from IMF. See: International Monetary Fund. 2021. World Economic Outlook: Managing Divergent Recoveries. Washington, DC, April.
b Weighted average, GDP weights.
High energy prices and investments in the oil and gas sector, including petrochemicals, were the main growth drivers in Kazakhstan and Turkmenistan. Kazakhstan's economic growth is associated with oil and natural gas investments, good macroeconomic management, and investments in infrastructure. In addition, economic diversification has begun recently as food processing, machinery, oil refining, and chemicals showed strong growth. Turkmenistan’s high growth rate in 2011–2015 is based on official figures. The country is the weakest reformer in Central Asia but has benefited from natural gas exports, a construction boom, and foreign investment in the textiles sector.
Among the non-oil economies, growth in the Kyrgyz Republic averaged around 4.2 % in 2001–2010, 4.9 % in 2011-2015, and average growth supported in 2016 to 2019 due to a buoyant minerals sector led by gold exports and a rebound in the agricultural sector.
Uzbekistan’s economy grew steadily at over 7,0 to 7,5% as agricultural production benefited from restructuring and privatization and favorable cotton prices. In Tajikistan, aluminum exports, remittances from migrant workers, and foreign aid served as the main impetus for expansion. GDP growth averaged about 7.0 % during 2011–2015 and kept growing in the forwarded years.
The global economy was highly concerned with the main threats in 2019 about the trade war between the US and China, the US presidential election, and Brexit on the global economy. Considering those arguments, IMF projected 1.7 % for advanced and 3.9 % for emerging markets and developing economies in 2019. The sudden health and economic crisis caused by COVID-19 has disrupted the global economy and left traces of side effects, causing a shock to supply and demand worldwide economies. According to the latest observations of international organizations, the world economy is emerging from one of the deepest recessions and begins to recover. Policymakers in public health, debt management, budget policies, central banking, and structural reforms are trying to ensure global economic recovery for sustainable growth and development over the long term.
Among advanced economies, the United States is expected to surpass its pre-COVID GDP level in 2021, while many others will return in 2022. Similarly, among emerging markets and developing economies, China had already returned to pre-COVID GDP in 2020, whereas many others are not expected to do so until well into 2023. In particular, the growth of GDP fell to -0.7 % in the Central Asian region. Growth in Central Asia will rebound to 4.8 % in 2021, boosted by moderate increases in commodity prices and foreign direct investment.
Demography
In economic terms, population growth creates more opportunities to enhance the market potential for business by creating more demand and supply in market mechanisms. Central Asia is home to 73.8 million people, growing by 1.8 % annually, making it the fastest-growing population in the region and the world (Table 2.). The female population makes up half of the total population. In addition, half of the region's population lives in cities. Furthermore, the population density is 18.5 people per square kilometer across the entire land area. The labor force capable of being actively engaged in various sectors of the economy makes up about 67 percent of the total population of Central Asia countries.
Table 2. Population growth in 2019, million
|
Total population, |
Annual growth, % |
Female population, % |
Urban population, % |
Population density |
Percent of population under the age of 16-64 |
|
|
Kazakhstan |
18.5 |
1.3 |
51.5 |
57.5 |
9.9 |
62.9 |
|
Turkmenistan |
5.9 |
1.6 |
50.8 |
52.0 |
12.1 |
64.7 |
|
Kyrgyz Republic |
6.5 |
2.1 |
50.5 |
36.6 |
32.3 |
62.8 |
|
Tajikistan |
9.3 |
2.4 |
49.6 |
27.3 |
65.4 |
59.8 |
|
Uzbekistan |
33.6 |
1.9 |
50.1 |
50.4 |
74.8 |
66.6 |
|
Central Asian Republics |
73.8 |
1.9 |
50.5 |
48.5 |
18.5 |
64.4 |
Source: World Bank Data, 2019.
Although the weighted population growth rate is continuously keeping almost the same level in all countries in Central Asia, Uzbekistan and Kazakhstan are the most populated countries in this region, with 33.6 and 18.5 million, contrary to Tajikistan, Kyrgyzstan, and Turkmenistan are 9.3, 6.5 and 5.9 million number in the population, respectively.
Although, having the total population (about 74 million) of the region and total GDP (about US $357 billion) is like that of medium-sized economies like the Philippines, Vietnam, or Egypt[1]. This provides for a reasonable regional market. Achieving economies of scale in production and distribution associated with a regional market is key for regional cooperation. The geographical size of the Central Asian countries, in terms of their surface area of 4,000,037 square kilometers (km2), is like the whole of Western Europe or India, which can be counted among the world’s largest regions.
Fig. 1. Population (in million), 2020
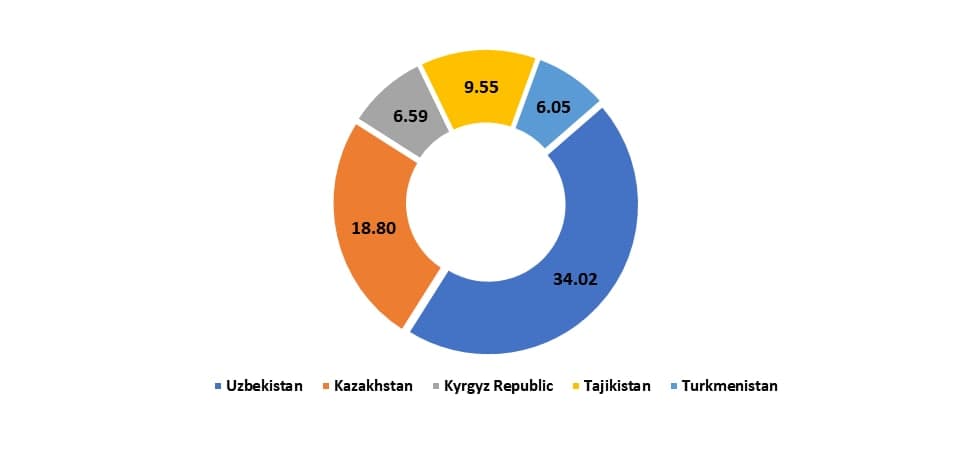
Source: The World Bank Data
Although Uzbekistan has the largest population (see Fig. 1.), Kazakhstan dominates the region both in geographical size and income level. Kazakhstan has about 70% of the land area compared with other countries and generates more than 58% of income in the region. Using its abundant natural resources of oil and natural gas can serve as an engine of growth for the rest of the region, particularly in facilitating the flow of materials to Russia, Europe, and the People’s Republic of China (PRC). The region is rich in minerals and has a strong agricultural base. Much of the recent growth in the region has been achieved because of higher prices, increased production, and further investment in the minerals and agricultural sectors. These include gold mining in the Kyrgyz Republic; gas and oil investment, production, and export from Turkmenistan; petroleum exports and petrochemical production in Kazakhstan; and cotton production and exports to Uzbekistan.
Most of the population is young, energetic, and educated professionals. In Central Asia, the people with education ranging from preschool to higher education developed. Government fully covered education, including parts in higher educational institutions. Young people are trying to get national grants to study in universities. Moreover, many young people get education in world universities and research centers for the most advanced education.
2.4. Recognition of Positive Changes in Region
According to various observations and evaluations of international institutions and organizations for studying global indices by education, environment, jurisprudence, etc., Central Asian countries are improving their positions at prestigious ranking levels and overcoming barriers in these areas. There are some examples summarized in Table 3.
Table 3. Central Asian Countries in the view of Global Rankings
|
|
English proficiency |
Environment Index c |
Human development Index d |
Prosperity |
Peace Index f |
The Human Capital |
|||||
|
Rank |
Chan-gesb |
Rank |
Score |
Rank |
Score |
Rank, 2020 |
Chan-ges f |
Rank |
Chan-ges h |
||
|
Kazakhstan |
92 |
51 |
85 |
44.7 |
51 |
0.825 |
62 |
+18 |
70 |
64 |
0.63 |
|
Turkmenistan |
— |
|
92 |
43.9 |
111 |
0.715 |
109 |
-4 |
116 |
61 |
— |
|
Kyrgyz Republic |
96 |
53 |
105 |
39.8 |
120 |
0.697 |
90 |
+12 |
93 |
52 |
0.60 |
|
Tajikistan |
100 |
new |
114 |
38.2 |
125 |
0.668 |
112 |
+8 |
107 |
51 |
0.50 |
|
Uzbekistan |
88 |
57 |
88 |
44.3 |
106 |
0.720 |
97 |
+12 |
103 |
61 |
0.62 |
a EF English Proficiency Index, www.ef.com/epi;
b compared to 2019
c Environmental Performance Index 2020, www.epi.yale.edu;
d Human Development Report 2020, www.undp.org;
e Legatum Institute, Prosperity Index, www.prosperity.com;
f compared to 2010;
f Global Peace Index 2020, The Institute for Economics & Peace (IEP), www.economicsandpeace.org;
h compared to 2019;
i The Human Capital Index, 2020, The World Bank.
First, according to the EF EPI English Proficiency Index 2020, Central Asian countries, which classify as non-speakers’ countries, gained a better global position. Among them, Uzbekistan, which has the most populated country, gained 88th rank over 100 countries. Kazakhstan and Kyrgyzstan are positioned at 92 and 96, respectively. And Tajikistan has just joined into evaluated and ranked at 100 positions in the globe.
Second, according to the Environmental Performance Index (EPI) conducted by the Yale Center for Environmental Law & Policy among 180 countries on environmental health and ecosystem vitality, Central Asia countries take a leading position in environmental indicators. Kazakhstan ranked 85 with a 44.7 score, Uzbekistan ranked 88 with a 44.3 score, and Turkmenistan ranked 92 with a 43.9 score occupying a sustainable position worldwide. However, the rest of the participating countries, Kyrgyzstan, ranked 105 with a 39.8 score, and Tajikistan, ranked 114 with a 38.2 score, earn moderate positions.
Third, according to the Human Development Index conducted by the United Nations Development Program, Central Asia occupies a strong position compared to other developed and developing countries. Human Development Index (HDI) is a composite index measuring average achievement in three basic dimensions of human development: a long and healthy life, knowledge, and a decent standard of living. Amongst 190 ranking positions worldwide, this index ranges from a high 51 rating position, Kazakhstan, Uzbekistan 106, Turkmenistan 111, Kyrgyzstan 120, and a low 125 rating position Tajikistan.
Fourth, Prosperity. Prosperity means everyone, regardless of the darkness of the days, has the opportunity and responsibility to fulfill their unique potential and play their part in strengthening their communities and nations. According to the Legatum Institute of measuring Prosperity Index, over 160 nations, Central Asia countries, except Turkmenistan, demonstrate reliable positive changes during the last decades.
Fifth, the Global Peace Index (GPI), developed by the Institute for Economics and Peace (IEP), provides the most comprehensive analysis to date trends in peace, its economic value, and how peaceful societies evolve. The countries of Central Asia are the most delicate in Eurasia and 70th among the most peaceful countries. The region gradually improves safety and security, with the most significant improvements in relations with neighboring countries, decreases mortality from external conflicts, and average homicide rates.
Sixth, according to The Human Capital Index (HCI)[2] indicator, conducted annually by the World Bank, Kazakhstan, Uzbekistan, Tajikistan, and Kyrgyzstan range from 0.5 to 0.63. People’s health and education have undeniable intrinsic value, and human capital also enables people to realize their potential as productive members of society. More human capital is associated with higher earnings for people, higher income for countries, and stronger community cohesion. It is a central driver of sustainable growth and poverty reduction. Despite a strong correlation between the HCI and gross domestic product per capita, human capital does not always move in lockstep with economic development. Economies like Kazakhstan, Kyrgyzstan, and Uzbekistan have higher human capital outcomes than predicted by their gross domestic product per capita.
Income of Population, Causing Significantly Purchasing Parity, Is Increasing
For thirty years, Central Asia countries have pursued a policy of developing a market-oriented economic system as a sovereign independent state. As an economic barometer (see Table 2.5.1), per capita income in Central Asia has also grown tremendously. In the third decade (from 2011 to 2020), the region's per capita income (US$) increased on average to $4427.5. In contrast, the average growth in the last first and second decades was $1981.6 and $2898.4. According to the World Bank country classification, most Central Asian countries remain medium-income countries. For example, Kazakhstan and Turkmenistan belong to upper-medium income countries, whereas Uzbekistan and Kyrgyzstan are lower-medium income and Tajikistan low-income countries.
The two oil-exporting countries have significantly higher per capita incomes than the non-oil exporters indicating a divergence in prosperity within the region. This divergence between oil exporters and non-oil exporters is also visible in figures for per capita income in PPP$. Moreover, the Central Asian regions surpassed the pre-crisis level of per capita income since 1997, creditable.
Table 4. GDP Per Capita
|
|
1991-2000 Average |
2001-2010 Average |
2011-2020 Average |
2018 |
2019 |
2020a |
Purchasing Power Parity b |
|
Oil Exporters |
|||||||
|
Kazakhstan |
4265.9 |
7348.0 |
10634.0 |
11165.5 |
11518.4 |
11046.7 |
27517.6 |
|
Turkmenistan |
2409.0 |
3207.6 |
6733.4 |
7647.9 |
7997.5 |
7911.5 |
15207.0 |
|
Non-oil Exporters |
|||||||
|
Kyrgyz Republic |
673.2 |
781.8 |
1016.5 |
1090.9 |
1116.4 |
1005.7 |
5485.6 |
|
Tajikistan |
553.4 |
612.6 |
966.2 |
1073.0 |
1121.1 |
1143.9 |
3529.3 |
|
Uzbekistan |
956.8 |
1274.3 |
2143.4 |
2373.5 |
2459.0 |
2466.3 |
7308.4 |
|
Central Asian Republics |
1981.6 |
2898.4 |
4427.5 |
4740.2 |
4890.7 |
4748.9 |
11809.6 |
Source: World Bank Development Indicators, Constant 2010, US dollars
a predicted value by author.
b GDP, PPP (constant 2017 international $), 2019. Long definition: PPP GDP is gross domestic product converted to international dollars using purchasing power parity rates. An international dollar has the same purchasing power over GDP as the U.S. dollar has in the United States. GDP is the sum of gross value added by all resident producers in the country plus any product taxes and minus any subsidies not included in the value of the products. It is calculated without making deductions for depreciation of fabricated assets or for depletion and degradation of natural resources. Data are in constant 2017 international dollars.
Natural Resources Toward Building Industrialization, Infrastructure, and Competitive Consumer Markets
In past decades, Central Asian countries were the economies based on using natural resources. However, they currently focus on building industrialized economies, connecting all economic sectors with highly capable infrastructure, and enhancing the real market-oriented competitive consumer markets.
The Central Asian countries are rich with abundant natural oil, natural gas, gold, and other minerals. Historically, these resources were utilized and developed when these countries were a part of the former Soviet Union. After independence, their appropriate use and development became a key component in the economic growth strategy for the region.
It is necessary to understand the natural resource profile for the Central Asian countries to appreciate the importance and scope of these resources for the region's economic development. Natural resources, particularly oil and natural gas and gold and aluminum, represent a significant proportion of the region's exports and the major source of government tax receipts. In conjunction with foreign direct investment and some domestic private savings, these tax revenues are the funding source for the buildup of industrial capacity and provide resources for social sector spending on education and health.
According to the Centre for Energy Economics Research and Policy, oil and natural gas reserves and production in 2019 (see Tables 5). The main oil and gas exporting countries in Central Asia are Kazakhstan, Turkmenistan, and Uzbekistan. According to these statistics, Kazakhstan is dominant in oil reserves and production capacities compared with Turkmenistan and Uzbekistan. It has huge oil reserves, which have 30 billion barrels by 2019, or 1.7% of the world's oil reserves. At the same time, Turkmenistan has 19.5 trillion cubic meters of reserves or 9.8 percent of the world's natural gas reserves. Both Turkmenistan and Uzbekistan produced 1.6 percent of world gas production volume in 2019. Moreover, Kazakhstan, Turkmenistan, and Uzbekistan are three major oil and gas exporters to add the Kyrgyz Republic, which mines and exports gold. Tajikistan and Uzbekistan depend on cotton exports.
Table 5. Oil and Natural Gas Endowments and Production, 2019
|
Proven reserves |
Oil reserves |
Share of total world oil reserves (%) |
Natural Gas reserves (trillion cubic meters |
Share of total world gas reserves (%) |
|
Kazakhstan |
30.0 |
1.7 |
2.7 |
1.3 |
|
Turkmenistan |
0.6 |
0.05 |
19.5 |
9.8 |
|
Uzbekistan |
0.6 |
0.05 |
1.2 |
0.6 |
|
Russian Federation |
107.2 |
6.2 |
38.0 |
19.1 |
|
Iran |
155.6 |
9.0 |
32.0 |
16.1 |
|
Saudi Arabia |
297.6 |
17.2 |
6.0 |
3.0 |
|
Iraq |
145.0 |
8.4 |
3.5 |
1.8 |
|
Total World |
1733.9 |
|
198.8 |
|
|
Annual Production |
Oil production |
Share of total world oil production (%) |
Gas production (billion cubic meters |
Share of total world gas production (%) |
|
Kazakhstan |
1931 |
2.0 |
23.4 |
0.6 |
|
Turkmenistan |
264 |
0.3 |
63.2 |
1.6 |
|
Uzbekistan |
62 |
0.1 |
56.3 |
1.4 |
|
Russian Federation |
11540 |
12.1 |
679.0 |
17.0 |
|
Iran |
3535 |
3.7 |
244.2 |
6.1 |
|
Saudi Arabia |
11832 |
12.4 |
113.6 |
2.8 |
|
Iraq |
4779 |
5.0 |
10.6 |
0.3 |
|
Total World |
95192 |
|
3989.3 |
|
Source: British Petroleum Statistical Review of World Energy 2020.
Over twenty years of economic development, the countries of Central Asia have been moving towards increasing the production capacity of raw materials industries and increasing value-added products and services through structural changes and transformation in the economies resulting in a shift toward industrial goods and minerals and away from agriculture. For example, in oil exporters countries, from 2000 to 2019, the share of the agricultural and industrial sectors in Kazakhstan decreased, while it increased in the service sector (see Table 6.). According to the official data of Turkmenistan, a sharp decrease is observed in the agricultural sector, while the share of industry has increased distinctly. An interesting fact can be observed that having had a sharp change in the structure of the agricultural and industrial sectors, the share of the service sector has steadily decreased.
Table 6. Sector Shares of Agriculture, Industry, and Services Sector 2000 and 2019 (% of GDP)
|
|
Agriculture |
Industry |
Service |
||||||
|
2000 |
2019 |
56 |
2000 |
2019 |
56 |
2000 |
2019 |
56 |
|
|
Oil Exporters |
|
|
|
|
|
|
|
|
|
|
Kazakhstan |
8.6 |
4.8 |
6 |
40.1 |
35.6 |
6 |
51.3 |
59.7 |
5 |
|
Turkmenistan |
22.9 |
11.5 |
6 |
41.9 |
60.0 |
5 |
35.2 |
28.5 |
6 |
|
Non-oil Exporters |
|
|
|
||||||
|
Kyrgyz Republic |
36.6 |
13.4 |
6 |
31.3 |
30.7 |
6 |
32.1 |
55.9 |
5 |
|
Tajikistan |
27.3 |
22.1 |
6 |
38.4 |
29.3 |
6 |
34.3 |
48.6 |
5 |
|
Uzbekistan |
34.4 |
28.1 |
6 |
23.1 |
36.4 |
5 |
42.5 |
35.5 |
6 |
Source: The World Bank Data, Constant 2010, US dollars
Among non-oil economies, there was an increase in the share of the service sector in GDP in Tajikistan and Kyrgyzstan. In contrast, the share of industry and the agricultural sector decreased. Uzbekistan undergoes industrialization policies by increasing its GDP share and decreasing the share of the agricultural sector. At the same time, the share of the service sector has also decreased due to the rapid growth in the industrial sectors. This largely depends on processing cotton raw materials and value-added textile products, oil and gas products, the automotive industry, and processing in heavy industries.
In addition, oil and gas have been the main driving force of the industrial sector for many years in the Central Asian countries in the past. Due to structural transformations in the regional economy, it has already given way to the main factor influencing the sectors of the economy. As a background to the comparative analysis, it would be useful to review aspects of industrial performance in Central Asian countries and the composition of manufactured exports (see Tables 2.6.3 and Table 2.6.4). The countries of Central Asia differ significantly in the level of industrialization. In 2020, manufacturing value-added per capita in oil exporters ($958.8) was four times higher than in non-oil exporting countries ($ 217.4), indicating that the dynamic oil and gas sector has spurred the development of the manufacturing industry.
For example, the average grew in manufacturing value-added in Central Asian countries reached 21.6 % between 2010 and 2020. At the same time, this indicator has grown, and it grew at 14.2 % per year in Kazakhstan and 32.8 % per year in Uzbekistan during this period. The value in oil exporters shown in Table 2.7, higher at 24.4 % per year, whereas 19.7 % per year in non-oil exporters countries. Manufacturing value-added per capita also increased. By 2020 Kazakhstan had the largest manufacturing base in Central Asia while Tajikistan had the smallest. The remaining countries in the region fall in between these extremes. The recent industrial recovery in the Central Asian countries is closely linked to manufactured exports that grew about 11.0 % per year for the region between 2010 and 2020. Both oil and non-oil exporters had respectable manufactured export growth. However, the former (12.3%) was somewhat lower than the latter (9.3 %).
Table 7. Selected Indicators of Industrial Performance in Central Asia
|
|
Annual Average MVA Growth (%) |
MVA per capita ($) |
Manufactured exports ($, mln) |
Annual Average Manufactured Export Growth (%) |
Manufactured Exports per capita ($) |
|
|
|
2010-2020 |
2020 |
2020 |
% |
2010-2020 |
2020 |
|
Oil Exporters |
24.4 |
952.8 |
54,729.0 |
76.9 |
12.7 |
2237.9 |
|
Kazakhstan |
14.2 |
1121.4 |
46,949.7 |
66.0 |
13.7 |
2535.9 |
|
Turkmenistan |
34.7 |
297.4 |
7,779.3 |
10.9 |
15.5 |
1309.2 |
|
Non-oil Exporters |
19.7 |
217.4 |
16,403.6 |
23.1 |
9.3 |
332.3 |
|
Kyrgyz Republic |
11.7 |
186.6 |
1,964.5 |
2.8 |
9.5 |
304.2 |
|
Tajikistan |
14.4 |
86.8 |
1,311.9 |
1.8 |
8.4 |
140.7 |
|
Uzbekistan |
32.8 |
259.3 |
13,127.3 |
18.5 |
10.4 |
390.9 |
|
Total |
21.6 |
447 |
71,132.7 |
100.0 |
11.0 |
963.7 |
Source: The World Bank Group, International Trade Statistics (www.intracen.org).
The structure of manufacturing and manufactured exports varies from country to country. Still, it means that oil and gas exporters are no longer the main driving force of the industrial sector. Kazakhstan is a huge and rich country. At the same time, there were actively carried out reforms in structural change in the economy. Kazakhstan’s manufactured exports are dominated by iron and steel, focusing on chemicals and plastics and machinery and transport equipment. It exported over $46.9 billion goods and products in 2020 and occupied 66 percent of the entire export potential of the Central Asian region.
For example, according to the data provided in Table 2.6.3, $ 30.9 billion or 65.9 percent of the share of Kazakhstan's exports falls on mineral products, which defines oil and petroleum oil products and natural gas. At the same time, Turkmenistan is also a leader in the extraction of mineral products, and these products account for $ 6.8 billion, or 88.1 percent of the export share for 2020. However, the share of mineral products exports in Kyrgyzstan and Tajikistan ranks second and in Uzbekistan fifth. Kyrgyzstan, Tajikistan, and Uzbekistan exports are specified as precious stones and metals, jewelry products. They are natural pearl, gold, diamond, platinum, etc., extracted from the earth's bowels. Kyrgyzstan mainly mined gold, and its exports amounted to $ 1 billion, accounting for 51.5 percent of its total exports. At the same time, there were mainly engaged in extracting gold and aluminum and exported $ 593 million in Tajikistan, or 45.4 percent of which is the entire share of the country's export.
The second-largest exported commodity in Kazakhstan is base metals, iron, steel, copper, nickel, aluminum, zinc, etc. amounted to $ 7,5 billion or 16.2 percent of the total share. Further, chemical products for $ 2.7 billion or 5.8 percent of the total share of exports, fruits, and vegetables for $ 2.3 billion, or 5.1 percent, etc.
Despite Turkmenistan being a major exporter of oil and natural gas products, the country has undergone significant structural changes throughout the country's economy. The export potential of the cotton and textile industry is developing in the country. The export volume of which is $ 239.3 million, or 3.1 percent of the total export share.
Table 8. Composition of Manufactured Exports, 2020 ($, Millions and Percent)
|
Product type[3] |
Kazakhstan |
Turkmenistan |
Kyrgyzstan |
Tajikistan |
Uzbekistan |
||||||
|
Values |
% |
Values |
% |
Values |
% |
Values |
% |
Values |
% |
||
|
Total |
46,949.7 |
100.0 |
7,779.3 |
100.0 |
1,964.5 |
100.0 |
1,311.9 |
100.0 |
13,127.3 |
100.0 |
|
|
Mineral products |
30,927.5 |
65.9 |
6,852.7 |
88.1 |
269.7 |
13.7 |
274.2 |
20.9 |
700.4 |
5.3 |
|
|
Base metals and articles |
7,596.1 |
16.2 |
48.2 |
0.6 |
78.4 |
4.0 |
187.1 |
14.3 |
1,065.2 |
8.1 |
|
|
Chemical products |
2,722.2 |
5.8 |
217.9 |
2.8 |
21.9 |
1.1 |
5.9 |
0.4 |
240.1 |
1.8 |
|
|
Vegetable products |
2,389.5 |
5.1 |
50.2 |
0.6 |
121.2 |
6.2 |
26.0 |
2.0 |
1,358.0 |
10.3 |
|
|
Machinery and mechanical appliances and electrical equipment |
1,291.5 |
2.8 |
204.8 |
2.6 |
107.8 |
5.5 |
11.3 |
0.9 |
442.7 |
3.4 |
|
|
Precious stones and metals, jewelry products |
698.9 |
1.5 |
- |
0.0 |
1,010.8 |
51.5 |
596.1 |
45.4 |
5,950.2 |
45.3 |
|
|
Beverages and tobacco |
484.2 |
1.0 |
3.1 |
0.0 |
49.8 |
2.5 |
8.8 |
0.7 |
107.5 |
0.8 |
|
|
Animal and vegetable edible fats products |
200.2 |
0.4 |
0.0 |
0.0 |
0.3 |
0.0 |
0.0 |
0.0 |
30.9 |
0.2 |
|
|
Animals and animal products |
192.4 |
0.4 |
0.3 |
0.0 |
79.2 |
4.0 |
0.4 |
0.0 |
25.6 |
0.2 |
|
|
Textiles |
146.2 |
0.3 |
239.3 |
3.1 |
89.9 |
4.6 |
196.3 |
15.0 |
2,109.6 |
16.1 |
|
|
Plastics and rubber |
128.4 |
0.3 |
144.7 |
1.9 |
43.4 |
2.2 |
0.5 |
0.0 |
330.8 |
2.5 |
|
|
Wood, cellulosic materials production etc. |
97.3 |
0.2 |
1.7 |
0.0 |
27.0 |
1.4 |
2.1 |
0.2 |
81.0 |
0.6 |
|
|
Stone, plaster, cement, ceramic and glass products |
43.5 |
0.1 |
9.2 |
0.1 |
38.3 |
1.9 |
0.2 |
0.0 |
65.9 |
0.5 |
|
|
Works of art and antiques |
25.2 |
0.1 |
1.2 |
0.0 |
14.5 |
0.7 |
- |
0.0 |
544.6 |
4.1 |
|
|
Raw hides and skins, leather, etc. |
4.0 |
0.0 |
5.9 |
0.1 |
7.6 |
0.4 |
2.9 |
0.2 |
34.4 |
0.3 |
|
|
Footwear, headgear, etc. |
2.6 |
0.0 |
0.2 |
0.0 |
4.6 |
0.2 |
0.0 |
0.0 |
40.4 |
0.3 |
|
Source: International Trade Statistics (www.intracen.org).
The Kyrgyz Republic has the most open trade regime in the regime and is the only Central Asian region to have joined the World Trade Organization in 1998. Liberalization of prices, trade, and foreign exchange systems have typically improved the most in reform-minded regions along with privatization of small and medium scale industries.
However, privatization of large-scale industry, competition policy, and reforms in banking finance has proceeded at a more moderate pace. Turkmenistan remains largely unreformed, with little prospect of adopting market-oriented reforms soon. Uzbekistan is a producer of natural gas, gold, and cotton. The share of exports of precious metals such as gold in 2020 accounted for 45.3 percent of total exports, totaling $ 5.9 billion. Uzbekistan's other exports include cotton and value-added textiles, totaling $ 2.1 billion, or 16.1 percent. Over the past years, Uzbekistan has diversified its economic potential. As a result, other sectors of the structure of industrial exports began to grow simultaneously, such as machinery and equipment, and food.
Inflation
The economies of Central Asian countries have undergone a deep transformation from central planning to market economies. The profound economic transformation after these countries became independent, combined with the liberalization of prices and trade, resulted in hyperinflation, general economic instability, and large fiscal and external imbalances. Inflation is a sustained rise in overall price levels. Moderate inflation is associated with economic growth, while high inflation can signal an overheated economy. Macroeconomic stability, proxied by inflation, has improved. Over the past few years, inflation rates have fallen significantly throughout the region, indicating improved macroeconomic stability (see Table 9.).
Average inflation for the Central Asian countries declined from 19.3 % to 8.1% between 2000–2010 and 2011–2020. Furthermore, there is no relationship between the impact of oil exporters and non-oil exporters on the inflation growth ratio, which was typically able to contain inflation at lower levels in the past. This may be partly the result of greater fiscal and monetary discipline and greater stability in the exchange rate, and moderate inflation worldwide. Kyrgyzstan had the lowest inflation among the Central Asian countries with 5.9 % in 2011-2020, and 0.4% in 2016, while Uzbekistan, with double-digit inflation, had the highest in 2011-2020. However, in 2016, inflation grew in Kazakhstan.
Table 9. Inflation
|
2001-2010 Average |
2011-2020 Average |
2016 |
2017 |
2018 |
2019 |
2020 |
2021* |
|
|
Oil Exporters |
|
|
|
|
|
|
|
|
|
Kazakhstan |
14.7 |
8.3 |
14.6 |
7.4 |
6.0 |
5.3 |
6.8 |
6.5 |
|
Turkmenistan |
20.6 |
6.6 |
3.6 |
8.0 |
13.2 |
13.0 |
10.0 |
8.0 |
|
Non-oil Exporters |
|
|
|
|
|
|
|
|
|
Kyrgyz Republic |
10.3 |
5.9 |
0.4 |
3.2 |
1.5 |
1.1 |
6.3 |
7.0 |
|
Tajikistan |
20.7 |
7.1 |
6.1 |
6.7 |
5.4 |
8.0 |
9.4 |
9.0 |
|
Uzbekistan |
30.1 |
14.1 |
8.8 |
13.7 |
17.5 |
14.6 |
12.9 |
10.0 |
|
Total |
19.3 |
8.1 |
6.7 |
7.8 |
8.7 |
8.4 |
9.1 |
7.6 |
Source: The World Bank Data, ADB 2021
* Forecasted value by ADB, 2021.
The inflation in the Central Asian countries moderately fluctuates from 6.7 in 2016 to 9.1% by 2020, that stable economic growth is also increased via rising production of goods and services over a 2016-2020 period. However, to be most accurate, the inflation rate steadily rose in 2020 due to the sudden health and economic crisis caused by COVID-19 that disrupted the global economy and left traces of side effects, including the effects of inflation on the global economy.
Facts, May Verify the Region be Growing Stably, are Important
The external sector performance of Central Asian countries has generally improved compared with the past due to several factors such as a structural change in share of overall production output of the economy of those countries, including industrial performance and increase export volumes.
However, the changes in the performance of the external sector of Central Asian countries fluctuate period by period, e.g., in 2001-2010 and 2011-2015, the average merchandise export growth (see Table 2.8.1) declined rapidly from 10.5 % to -7.6 %. The declining trend reached a high level in 2016 by negative -22.9 %. Then, it gradually increased to 19.9 % in 2017, in 2018, and 2019 by 18.4 %, and -0.2 %. These ups and downs of merchandise export have been driven by increased production of oil-exporting countries' minerals and metals. It specifies at increase and decrease of prices for gold and cotton in the non-oil exporting economies.
Table 10. Merchandise Export Growth (%)
|
2001-2010 Average |
2011-2015 Average |
2016 |
2017 |
2018 |
2019 |
|
|
Oil Exporters |
|
|
|
|
|
|
|
Kazakhstan |
14.1 |
-4.1 |
-25.3 |
24.1 |
20.8 |
-6.4 |
|
Turkmenistan |
2.2 |
-1.3 |
-43.6 |
6.6 |
22.1 |
1.3 |
|
Non-oil Exporters |
|
|
|
|
|
|
|
Kyrgyz Republic |
10.3 |
0.6 |
8.4 |
10.8 |
4.0 |
7.5 |
|
Tajikistan |
2.2 |
-1.1 |
0.9 |
25.0 |
-11.6 |
8.6 |
|
Uzbekistan |
12.5 |
1.1 |
-5.2 |
11.0 |
7.7 |
22.1 |
|
Total |
10.5 |
-7.6 |
-22.9 |
19.9 |
18.4 |
-0.2 |
Source: The World Bank Data, ADB 2021
In addition, manufacturing has also been buoyant, and the overall performance has improved from a decade ago. In Kazakhstan, the export of goods was reflected by stable growth in 2001-2010 at an average of 14.1 %, and in the period 2011-2015, the average negative 4.1% decreased. Only in 2016, the maximum level decreased to -25,3 %. And in 2017 and 2018, it increased by a positive 24.1% and 20.8%, respectively. The value of merchandise exports from Kazakhstan totaled $57 billion in 2019. Overall commodity exports from Kazakhstan decreased by -6,4 % compared to 2018. Merchandise exports decreased by $ 3.6 billion (the value of merchandise exports from Kazakhstan amounted to $61 billion in 2018). This trend can be observed in oil-producing countries like Turkmenistan.
For the non-oil exporting countries in the region, export performance accelerated during 2001-2010. By 2016, export growth in the Kyrgyz Republic, Tajikistan, and Uzbekistan was supported by 8.4 %, 0.9 %, and -5.2 %, respectively. In the Kyrgyz Republic, export growth has fluctuated from negative to strong, primarily because of gold prices and gold and petroleum products exports. Therefore, the export of goods during 2001-2010 significantly grew well on average 10.3 %, and then the average growth fell to 0.6 % in 2011-2015. Again, it fluctuated, consequently increasing by 8.4 % in 2016, 10.8% in 2017, and steep decreasing by 4 % in 2018 and harmonized on 7.5 % in 2019. In Tajikistan, exports of cotton and aluminum steadily increased as the economy continues to recover. The tends shows that the export potential is not predictable year by year by ups and downs. In Uzbekistan, export growth picked up strongly in 2017 and 2019 on the back of higher prices for gold and cotton. In Uzbekistan, export growth picked up strongly in 2017 and 2019 on the back of higher prices for gold and cotton. Uzbekistan demonstrated a strong policy to enhance and stabilize production output sectoral reforms to accelerate the extractive sectors and raw materials. The reforms pushed to develop production capacities of products and services with value-added capabilities. Therefore in 2019, the export grew by 22.1 %.
Foreign Direct Investment
The wider context for the subject of this section is best provided by a twenty-year perspective on the trajectory of global business activity, as represented by flows of foreign direct investment (FDI). Recorded FDI flows have demonstrated remarkable global growth, from under US$ 220 billion in 1993 to over US$1,530 billion in 2019. Over that same period, the total stock of FDI in Central Asian countries has grown from roughly US$1.4 billion to almost US$8.0 billion. This section, devoted to foreign direct investment growth dynamics, examines the main driving forces responsible for the active FDI activity in Central Asia.
There is neither a single theoretical framework to explain FDI decisions nor a single empirical procedure to establish relations between FDI and its determinants. In addition, none of the existing contributions even consider the network configuration of each country's full stock foreign investment positions.
Since 1980, two related developments have helped determine the industrial organization of multinational enterprises (MNEs) and the global increase in FDI activity. The first has been the ongoing process of policy liberalization by host countries towards foreign investment due to multilateral trade agreements and pressures for structural adjustment and intense competition between host countries seeking to capture and harness the beneficial impacts of FDI. This liberalization process has resulted in decreasing costs of both cross-border trading and investment activity. Clear evidence of the liberalization of the policy environment and its regulatory framework is provided by the increasing number of pro-FDI changes in the investment regimes of many host countries[4]. The second development has been the geographical spread of international production and service networks in different locations, apparent in industrialized and developing countries (UNCTAD, 1993b, 2001). This spatial distribution, driven in large part by MNEs’ seemingly continual search for efficiency gains to counter both increasing production costs and price competition, and the perils of exogenous shocks (such as the oil price shocks), is hallmarked by the strategic integration of MNE headquarters, subsidiaries, and affiliates.
Three decades ago, five Central Asian countries left the cradle of a centrally planned economy to transition to a market-based economy. Macroeconomic dynamics show that, at present, the five countries are at different milestones of transition. The transition from plan to market and socialism to capitalism has been described as one of the most important economic, social, and political experiments of modern times.
Table 11. Distribution of global FDI inflows, 1980-2019 (%)
|
Region |
1980-1985 |
1986-1991 |
1992-1995 |
1996-2000 |
2001-2007 |
2008-2014 |
2015-2019 |
2019 |
|
Developed countries |
69.3 |
81.5 |
63.47 |
71.11 |
65.30 |
51.97 |
56.99 |
51.97 |
|
Western Europe |
10.8 |
16.93 |
18.39 |
21.14 |
19.15 |
10.9 |
13.3 |
8.8 |
|
European Union |
27.6 |
40.34 |
38.99 |
42.05 |
44.58 |
29.5 |
31.0 |
27.9 |
|
- United States of America |
32.7 |
32.40 |
17.43 |
23.59 |
14.56 |
14.6 |
19.2 |
16.0 |
|
- Japan |
0.6 |
0.34 |
0.54 |
0.60 |
0.81 |
0.5 |
0.7 |
0.9 |
|
Developing economies |
30.6 |
18.44 |
35.46 |
27.78 |
31.52 |
42.8 |
40.2 |
44.5 |
|
Africa |
2.9 |
1.96 |
2.21 |
1.42 |
2.74 |
3.7 |
2.8 |
2.9 |
|
Latin America and the Caribbean |
10.5 |
5.06 |
8.93 |
9.87 |
8.10 |
11.1 |
8.9 |
10.7 |
|
- Brazil |
3.4 |
0.78 |
1.00 |
3.19 |
2.13 |
4.4 |
3.5 |
4.7 |
|
- Mexico |
3.7 |
2.07 |
2.95 |
1.90 |
2.98 |
2.0 |
2.0 |
2.1 |
|
Eastern Europe |
0.0 |
0.35 |
3.24 |
2.86 |
5.72 |
5.6 |
3.4 |
4.7 |
|
- Russian Federation |
— |
— |
0.53 |
0.52 |
1.66 |
2.8 |
1.4 |
2.1 |
|
Asia |
17.0 |
11.30 |
24.20 |
16.46 |
20.63 |
27.8 |
28.5 |
30.8 |
|
Central Asia |
— |
— |
0.36 |
0.24 |
0.52 |
1.2 |
0.5 |
0.5 |
|
- Kazakhstan |
— |
— |
0.295 |
0.193 |
0.433 |
0.847 |
0.271 |
0.202 |
|
- Kyrgyzstan |
— |
— |
0.016 |
0.010 |
0.009 |
0.029 |
0.024 |
0.014 |
|
- Tajikistan |
— |
— |
0.004 |
0.003 |
0.013 |
0.023 |
0.020 |
0.014 |
|
- Turkmenistan |
— |
— |
0.048 |
0.016 |
0.043 |
0.229 |
0.132 |
0.141 |
|
- Uzbekistan |
— |
— |
0.012 |
0.019 |
0.019 |
0.068 |
0.086 |
0.148 |
|
Eastern Asia |
4.5 |
5.95 |
15.05 |
11.13 |
12.62 |
15.1 |
16.3 |
16.1 |
|
- China |
3.6 |
4.89 |
13.96 |
9.71 |
10.72 |
13.8 |
14.9 |
14.3 |
|
- Korea, Republic of |
0.3 |
0.72 |
0.54 |
0.82 |
1.07 |
0.7 |
0.7 |
0.7 |
|
South-eastern Asia |
5.3 |
4.98 |
7.94 |
4.69 |
4.27 |
6.4 |
8.1 |
10.1 |
|
- Indonesia |
0.4 |
0.46 |
1.04 |
0.41 |
0.20 |
1.0 |
1.0 |
1.5 |
|
- Malaysia |
1.8 |
1.01 |
2.32 |
0.85 |
0.44 |
0.6 |
0.5 |
0.5 |
|
- Philippines |
0.3 |
0.34 |
0.52 |
0.24 |
0.15 |
0.2 |
0.4 |
0.3 |
|
- Thailand |
0.5 |
0.79 |
0.82 |
0.66 |
0.70 |
0.6 |
0.3 |
0.3 |
|
- Viet Nam |
0.0 |
0.06 |
0.50 |
0.31 |
0.24 |
0.6 |
0.8 |
1.0 |
|
Southern Asia |
0.3 |
0.17 |
0.67 |
0.64 |
1.59 |
2.9 |
3.1 |
3.7 |
|
- Pakistan |
0.1 |
0.11 |
0.21 |
0.08 |
0.18 |
0.2 |
0.1 |
0.1 |
|
Western Asia |
7.6 |
0.64 |
1.36 |
1.14 |
3.73 |
4.7 |
2.9 |
3.2 |
|
- Turkey |
0.1 |
0.27 |
0.33 |
0.13 |
0.71 |
0.9 |
0.7 |
0.5 |
|
Others (Oceania) |
0.2 |
0.13 |
0.11 |
0.03 |
0.05 |
0.2 |
0.1 |
0.1 |
|
World |
100.0 |
100.00 |
100.00 |
100.00 |
100.00 |
100.0 |
100.0 |
100.0 |
Sources: UNCTAD World Investment Report, 2021. Foreign direct investment.
Many policymakers and academicians contend that FDI can positively affect a host country’s development effort. The FDI acts as a supplier of direct capital financing and a source of valuable technology and know-how that can help jumpstart an economy. The distribution of foreign direct investment shows a significant increase in foreign investment flows to developing countries, from about US$ 75 billion in 1990 to less than US$ 685 billion in 2019 (UNCTAD, 2021). Table 2.9.1 shows that Central Asia's average share of global FDI flows has fluctuated significantly over the past three decades, increasing from 0.36 % in 1992-1995 to 1.2 percent in 2008-2014, then declining to 0.5 % in 2015-2019, and remained 0.5 % in 2019. A decline in FDI growth from 1996-2000 to 0.24 % in Central Asia is typical for most developing countries, except Brazil and South Korea. In contrast, in developed countries, it has acquired a stable growth rate.
Table 12. Regional Foreign direct investment inflows compared, 1993-2019 (US$ million)
|
Region |
1993 |
1997 |
2000 |
2005 |
2010 |
2015 |
2019 |
|
World |
220,084.5 |
480,774.1 |
1,356,613.1 |
947,705.9 |
1,396,203.3 |
2,041,769.7 |
1,539,879.7 |
|
Industrialized economies |
159,218.8 |
322,884.1 |
1,197,417.7 |
665,849.6 |
859,623.7 |
1,503,637.6 |
983,306.7 |
|
United States of America |
50,663.0 |
103,398.0 |
314,007.0 |
104,773.0 |
198,049.0 |
467,625.0 |
246,215.0 |
|
Latin America |
13,823.4 |
65,920.3 |
79,790.0 |
77,148.0 |
160,669.7 |
156,412.1 |
164,236.5 |
|
Brazil |
1,290.9 |
18,992.9 |
32,779.2 |
15,066.3 |
77,686.8 |
49,961.4 |
71,989.3 |
|
Mexico |
4,388.8 |
12,829.6 |
18,249.3 |
26,034.5 |
27,130.8 |
35,351.6 |
32,921.2 |
|
Asia |
56,250.8 |
108,287.3 |
142,031.4 |
224,575.8 |
412,814.9 |
514,307.9 |
473,897.8 |
|
South-eastern Asia |
16,585.3 |
35,939.7 |
21,751.3 |
42,739.1 |
113,005.8 |
114,235.2 |
155,800.5 |
|
Indonesia |
2,003.0 |
4,729.0 |
-4,550.4 |
8,336.3 |
13,770.6 |
16,641.5 |
23,429.0 |
|
Philippines |
1,238.0 |
1,249.0 |
2,240.0 |
1,850.9 |
1,298.5 |
4,446.6 |
4,996.4 |
|
Thailand |
1,807.0 |
3,882.0 |
3,410.1 |
7,975.1 |
14,555.0 |
5,623.8 |
4,145.7 |
|
Viet Nam |
926.3 |
2,220.0 |
1,289.0 |
1,954.0 |
8,000.0 |
11,800.0 |
16,120.0 |
|
Southern Asia |
1,354.3 |
5,413.6 |
4,866.3 |
14,182.1 |
34,862.5 |
51,221.3 |
57,429.2 |
|
Pakistan |
399.3 |
711.0 |
309.0 |
2,201.0 |
2,022.0 |
1,673.0 |
2,218.0 |
|
Central Asia |
1,417.4 |
1,697.6 |
1,509.4 |
2,637.8 |
17,414.4 |
9,854.3 |
7,991.8 |
|
Kazakhstan |
1,271.4 |
1,321.9 |
1,282.5 |
1,971.2 |
11,550.7 |
4,056.6 |
3,118.1 |
|
Kyrgyzstan |
10.0 |
83.0 |
-2.4 |
42.6 |
437.6 |
1,141.9 |
208.6 |
|
Tajikistan |
9.0 |
18.0 |
23.5 |
14.2 |
157.4 |
571.7 |
212.8 |
|
Turkmenistan |
79.0 |
107.9 |
131.0 |
418.2 |
3,632.3 |
3,043.0 |
2,165.9 |
|
Uzbekistan |
48.0 |
166.8 |
74.7 |
191.6 |
1,636.4 |
1,041.2 |
2,286.3 |
Sources: UNCTAD World Investment Report, 2021. Foreign direct investment.
Central Asian share of the total FDI ‘pie’ changed, but the pie's size has grown. Between 1993 and 1997, global FDI inflows remained below US$500 billion annually, but between 2000 and 2019, they fluctuated from US$1,356 billion to US$1,539 billion (see Table 12). While global FDI flows have steadily expanded – from US$220 billion in 1993 to US$1,539 billion in 2019 –Central Asia's share grew from more than US$1.4 billion (or 0.64 % of global flows) in 1993 to its peak of US$17.4 billion (or 1.25 %) in 2010, before collapsing to US$7.9 billion in 2019. Specifically, China intensified its investment in Central Asia countries, especially in resource-rich countries such as Kazakhstan (main oil), Turkmenistan, and (mainly gas) in 2010[5]. Inward FDI increased, especially in resource-rich countries, due to the rebound in commodity prices and improved economic and financial conditions. For example, FDI inflows to Kazakhstan in the first quarter of 2010 reached $3 billion or 16 percent higher than the same period in 2009. Firms from developing and transition economies continued their reach for natural resources.
China initiated its investment in Central Asia by signing in April 1996 general economic and security agreements with the Central Asian economies of Kazakhstan, Kyrgyzstan, and Tajikistan. Since then, Chinese investment in the subregion has increased dramatically. Chinese firms built two oil and gas pipelines from Kazakhstan and Turkmenistan to China (inaugurated in 2006 and 2009, respectively), laying the ground for large-scale exploration and development of oil and gas fields. In Turkmenistan, the China National Petroleum Corporation (CNPC) is the only foreign company possessing an onshore contract for oil and gas exploration. In Kazakhstan, the China Investment Corporation bought a 14.5 % stake in KazMunaiGas, and CNPC bought a 49 % share of Mangistaumunaigaz for $2.6 billion, both in 2009. China’s Tebian Electric Apparatus is building power transmission lines and substations in Kyrgyzstan and Tajikistan in the electricity industry. In an offsetting deal, this company has acquired the right to extract gold, silver, copper, and tungsten in the Pamir Mountains of Tajikistan. Another company, The XD-Group, is modernizing the electricity system in the Uzbek capital, Tashkent[6]. In nuclear energy, CNPC formed a joint venture with Kazakhstan’s State-owned Kazatomprom to invest in uranium production in Kazakhstan. An affiliate of the China Guangdong Nuclear Power Corporation is in a joint venture to develop black-shale uranium in the Navoi Province of Uzbekistan.
Global FDI flows have grown over the US $ 1.300 billion since 2000, hovering at this level until 2019. Whereas, in industrialized countries, this indicator has a sharp increase in 2000 about US$ 1200 billion and then fluctuates at the level of US$ 660 billion to US$ 983 billion in 2019. FDI inflows to Asia grew strongly during this period, especially in Southern and South-eastern Asia. Along with this, in the Central Asian countries, especially in the large flow of FDI was attracted to Kazakhstan for the period in 2010 and accounted for the highest share in the Central Asian countries. In Turkmenistan, thanks to a large inflow of investments in the oil sector from China, the share of FDI increased in 2010 and 2015, but this indicator declined in 2019. Stable growth in FDI inflows is observed in Uzbekistan, like the Philippines and Thailand, where FDI inflows grow steadily every year. This trend of FDI in Uzbekistan suggests that the country is introducing and strengthening a strong policy of protecting foreign investment, improving investment climate policies, and providing great opportunities and protection for foreign investors. And the rest of the Central Asian countries, Tajikistan, and Kyrgyzstan have feeble policies to attract FDI.
Inflows to the country had concentrated in mining industries. In contrast, Uzbekistan had received more diversified FDI inflows in 2010. For instance, Uzbekistan attracted greenfield FDI projects in several manufacturing industries in 2010, including the automotive industry, building materials, chemicals, and consumer electronics. In 2011, a major cross-border merger and acquisition of "Polyus Gold" (Russian Federation) for $6.3 billion by KazakhGold Group (Kazakhstan) in the field of energy, mining, oil, and gas were carried out. Therefore, the recipients of the largest investments were Kazakhstan ($8.0 billion, compared with $2.5 billion in 2010), and Uzbekistan ($7.6 billion, compared with $2.4 billion in 2010), reflecting the destinations of large-scale projects.
Inflows to Uzbekistan more than tripled in 2019 (up 266 % to $2.3 billion). The value of equity investment and reinvested earnings together expanded by 231 percent to $2.1 billion, while intracompany loans turned from negative to positive (to $169 million). Part of the inflows related to ongoing large projects in oil and gas by Lukoil (Russian Federation). In addition, a series of projects started in chemical production with Chinese, Russian, Singaporean, United Kingdom, and United States firms. Orano Mining (France) invested large amounts in uranium exploration and development. In the textiles and apparel industry, projects were started by Chinese, German, Indian, Korean, Thai, and Turkish companies. However, FDI flows to Kazakhstan – the third-largest recipient of FDI among these economies declined again in 2019, dropping 17 % to $3.1 billion. The largest project started in the country was a carbide plant of a Chinese chemical producer.
The largest greenfield projects announced in 2019 included two Turkish electricity projects in Uzbekistan, all of which are expected to take place over multiple years (Table 13.).
Table 13. Largest announced greenfield projects, 2019
|
Home country |
Host country |
Business |
Industry |
Amount, $ mln. |
Investor |
|
Turkey |
Uzbekistan |
Electricity |
Coal, oil and gas, fossil fuel electric power |
996 |
Cengiz Enerji Sanayii ve Ticaret |
|
Turkey |
Uzbekistan |
Electricity |
Coal, oil and gas, fossil fuel electric power |
996 |
Yildirim Holding |
|
China |
Kazakhstan |
Manufacturing |
Chemicals, basic chemicals |
600 |
North Huajin Chemical Industries |
Recent Policies to Highlight Foreign Investment
As early as 2010, according to a UNCTAD[7], most investment promotion policies include simplifying business registration (for example, in Tajikistan and Turkmenistan) and reducing foreign exchange transactions (for example, in Kazakhstan). However, in one case, local content requirements in the subsoil sector were strengthened (Kazakhstan). Others have also lowered corporate tax rates (for example, in Uzbekistan).
Kazakhstan adopted a Law on State-Owned Property, which regulates the nationalization of private property in cases of threats to national security[8]. The Kyrgyz Republic nationalized one of the country’s largest banks, the foreign-controlled Asia Universal Bank[9].
FDI between developing countries and transition economies often involves large State-owned TNCs, following national strategic objectives. For this reason, integration schemes and regional cooperation encompassing these groups, such as the Shanghai Cooperation Organisation (SCO), play an important role.
The Silk Road Initiative seeks to enhance regional cooperation between China, Kazakhstan, Kyrgyzstan, Tajikistan, and Uzbekistan. The initiative is an important step in establishing networks, encouraging dialogue, bridging cultural divides, and promoting awareness of the potential for cooperation in the investment area between countries of the region.
Uzbekistan is an LLDC with a GDP of $39 billion and GDP per capita of $1,400 in 2010. FDI to the country has increased since the mid-2000s because of a privatization program. For instance, the Government privatized more than 600 enterprises each year in 2006 and 2007, and foreign investors purchased 28 companies for $115 million in 2007 alone. In recent years, the country has attracted some large greenfield projects in manufacturing, with many announced or implemented in 2010 (Table 14.).
Table 14. Selected FDI projects in manufacturing in Uzbekistan, 2010
|
Investor or project |
Industry |
Home country |
Investment ($ million) |
|
International Petroleum Investment Company |
Chemical |
United Arab Emirates |
1340 |
|
Ominvest |
Pharmaceuticals |
Hungary |
100 |
|
Knauf |
Building materials |
Germany |
50 |
|
EMG |
Ceramics and glass |
Iran, Islamic Republic of |
24 |
|
CLAAS |
Industrial Machinery |
Germany |
20 |
|
Erae Cs Ltd |
Automotive components |
Korea, Republic of |
13 |
|
LG |
Consumer electronics |
Korea, Republic of |
9 |
Source: UNCTAD, based on information from the Financial Times Ltd, fDi Markets (www.fDimarkets.com).
For instance, in the automotive components industry, Erie Cs Ltd (Republic of Korea) and Uztosanoat, a local company, established an international joint venture with a total investment of $13 million. The facility will supply 150,000 km of car cables per year to General Motors’ new plant in Uzbekistan, starting in the second half of 2011. Currently, GM Uzbekistan produces ten models of automotive vehicles in the country. With a total investment of $136 million, the new plant started to produce a compact sedan in 2011. In the petrochemicals industry, a $1.34 billion project is being funded by the United Arab Emirates. A company from Singapore has signed a deal for a joint venture project for polyethylene production.
These large projects illustrate the success of government policies in attracting FDI in manufacturing to Uzbekistan. A favorable investment climate and a sound framework of FDI legislation, which includes guarantees for foreign investors and certain preferences for them, have contributed to this success. It seems that institutional advantages can help Uzbekistan overcome its geographical disadvantages, and A case of Uzbekistan provides an example in this regard.
Uzbekistan set up a legal framework to regulate public-private partnerships, with fiscal benefits provided for selected private partners and established a presidential advisory body for investment. In January 2020, it also introduced a multi-tiered mechanism for investor-State dispute settlement and in February 2020, it adopted a law on special economic zones. In January 2020, Uzbekistan created a one-stop-shop mechanism to facilitate investment and it began to provide subsidies for investors constructing hotels if fulfilling certain requirements.
In 2020, Kazakhstan liberalized its arbitration framework, allowing the parties to choose a foreign law in a dispute involving the State and bringing enforcement provisions in line with the New York Convention.
[1] The Philippines has 106,6 million people and a GDP of 340.3 billion in 2018, Viet Nam has 95.5 million people and a GDP of $187.7 billion, and Egypt has 98.4 million people and a GDP of $286.3 billion.
[2] The Human Capital Index (HCI) ranges between 0 and 1. The index has measured the productivity of the next generation of workers relative to the benchmark of complete education and total health. An economy in which a child born today can expect to achieve comprehensive education and full health will score a value of 1 on the index. It is a fact that, over the past decade, many economies have made significant progress in improving human capital. Human capital consists of the knowledge, skills, and health that people accumulate over their lives.
[3] The product type is identified from the unified version of classification product nomenclature at Harmonized Tariff Schedule of the United States (2021). See: United States International Trade Commission, https://www.usitc.gov/tariff_affairs/hts_help
[4] In 1991, 35 countries introduced 82 changes in their FDI regimes, compared with 71 countries making 208 changes in 2001. In 1991, 97.6 percent of all changes made were pro-FDI, compared to 93.3 percent in 2001 (down from a high of 98 percent in 2000). East Asia introduced the highest number of pro-FDI changes.
[5] UNCTAD, "World Investment Report 2010: investing in a low-carbon economy", 2010.
[6] “Chinese-Central Asian Relationship Requires Delicate Balancing Act,” Radio Free Europe, 4 April 2010.
[7] UNCTAD, "World Investment Report 2010: investing in a low-carbon economy", 2010.
[8] Law on State Property, No. 413-IV, of 1 March 2011.
[9] Decree No.56, 7 June 2010.


